Jörgs Mass Spectrometry and Bioinformatics Page
Home |
Science and Software
MS programming |
Code snippets |
Bioinformatics |
Neuroscience

"Can anybody please explain Mole?" - "Well, in concept, it's similar to a dozen, but bigger."
(seen in sci.chem. For more of such "wisdom", look at this file).
I have been working in the field of mass spectrometry for about 15 years (... and that can really, really be fun!).
Through data processing I have moved into Bioinformatics and did some quite active software development there for several years.
If you are interested, you can also download a list of my scientific publications,
and you can find me on LinkedIn.
Things that I wrote
Most of the programs that I wrote are available under the terms and
conditions of the GNU Public License (GPL). This
means that the software is available free of charge, including the source code,
and the GPL ensures that any future version will also remain free.
"Frankly, compared to the data openness issue, code openness is minor and a bit of a no-brainer.
You should always open your code as it costs you nothing, enhances your reputation and generally helps you (and everyone else) tackle
the interesting problems out there."
- Ewan Birnmey, cited from Linux Magazine, 2002-06, 22-25.
MSGraph |
CDFread |
COMSPARI |
Isotope |
HiRes |
Match |
The Analyses Database |
The Chemicals Database |
HitKeeper |
NMR spectrum viewer
HitKeeper is a database application for use in BioInformatics.
It is intended to help bioinformatic researchers with "friendly" tools.
Originally designed for the investigation of the relationships between protein sequences and
motifs defined (or predicted) on them, it effectively handles the redundancy of biological
databases, incremental updates, supports taxonomy and has a sophisticated query engine.
HitKeeper was - and is - developed and is maintained by Marco Pagni, with contributions
from myself and many others ;-). It is mainly written in Perl/SQL and published under the
GNU Public License (GPL). It was first described in
J. Hau, M. Muller, M. Pagni, "HitKeeper, a generic software package for hit list management",
Source Code for Biology and Medicine 2 (2007), 2.

 HitKeeper has its own homepage at
http://hitkeeper.sourceforge.net/.
HitKeeper has its own homepage at
http://hitkeeper.sourceforge.net/.
COMSPARI is the acronym for COMparison of
SPectral And Retention Information.
It is a software to facilitate the analysis of "paired" samples, i.e. samples
that are almost identical yet present some qualitative difference, by
GC/MS and LC/MS as well as other techniques.
COMSPARI should thus be particularly useful for applications in metabolomics and proteomics.
COMSPARI was developed and is maintained by Jonathan Katz (with some contributions
from myself ;-) and was first described in J. E. Katz, J. Hau, D. S. Dumlao and S. Clarke,
"A New Technique (COMSPARI) to Facilitate the Identification of Minor Compounds in
Complex Mixtures by GC/MS and LC/MS: Tools for the Visualization of Matched Datasets",
J. Amer. Soc. Mass Spectrom.
15 (2004), 580-584.
A "by-product" of this development work is cdf2ascii, which is based
on cdfread. It allows to convert netCDF files into plain
ASCII files, with lots of processing options and is part of the COMSPARI package.
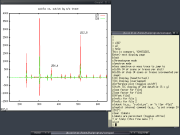
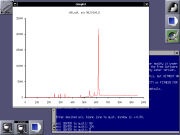
CDFread is a program that implements the routines to read mass spectra and
mass chromatograms from data files in netCDF ("Andi-MS") format. The program provides
a command-line interface and a simple graphic display based on gnuplot. It
supports mouse zoom and manual peak annotation. Centroid and profile data
are supported.
CDFread has its own homepage at http://cdfread.sourceforge.net/.
A derivative of cdfread is cdf2ascii, which is part of the
COMSPARI software described below. It allows
to convert netCDF files into plain ASCII files, with lots of processing options.
MSGraph is a program designed for the interactive, fast, qualitative
analysis of mass spectrometric (MS) data. It is a tool to provide fast and simple
access to all the information contained in an LC/MS analysis run. Key features:
- Call most functions directly, with a single keystroke or mouse click.
- Use the "eagle's view" (2D) display to visualise of all the information of an analysis run:
time, scan number, m/z and signal intensity at the same time.
- Use CODA COmponent Detection Algorithm to detect compounds and to perform "intelligent" background subtraction.
- Zoom by a point-and-draw action of the mouse.
- Switch between all displays with just one mouse click or keystroke.
- Browse spectra and mass chromatograms with one keystroke or mouse click.
- Integrate mass chromatograms manually using the mouse.
- Keep track of "interesting" mass traces by writing them to file.
- Get graphical data in high-quality Postscript format, including color output.
- Export data - mass spectra, mass chromatogram, integration results and even 2D - as ASCII files, e.g. for use with other graphics or spreadsheet software.
- ... and it is Free Software, published under version 2 of the GNU Public License (GPL)!
Several related tools are available, including programs to read data files in netCDF and mzXML format.

MSGraph has its own homepage at http://msgraph.sourceforge.net/.
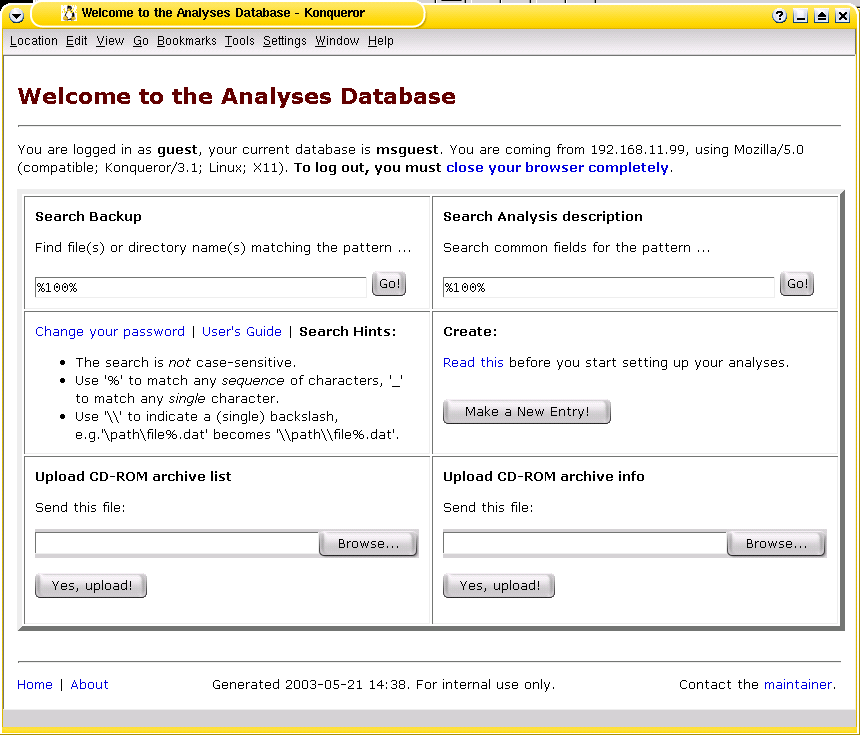
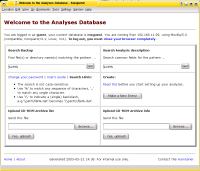
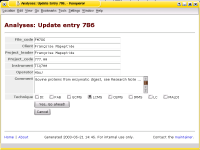
The Analyses Database is a collection of software to archive and to track files.
It was written with the backup and archival of data from analytical instruments in mind
and was first described in a paper by J. Hau and L. Fay, "Practical Approach to Archival
and Retrieval of Analytical Data in the Laboratory", published in
Analyst 126 (2001), 1194-1199.
This software has been used in my (former) laboratory for almost a decade now and has performed flawlessly -
thus I have good reasons to say that it performs as designed and that it is in a stable state.
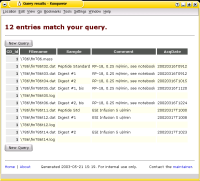
The project has its own homepage at http://labdb.sourceforge.net/.
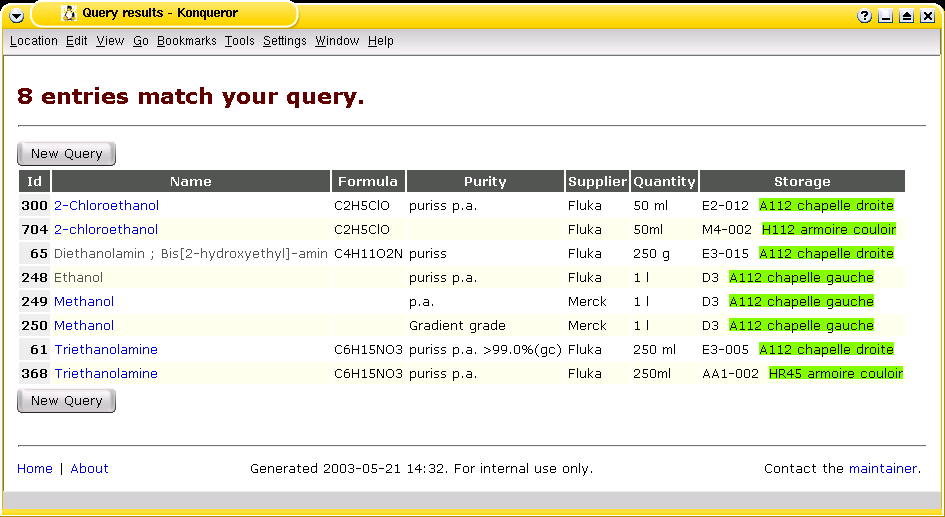
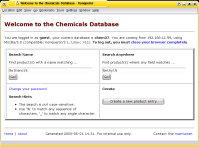
The Chemicals Database is a simple yet effective approach to track
a stock of products. It provides "product catalogue" that is accessible from
any workplace over http. —
Although the documentation describes the handling of a stock of chemicals in a laboratory in particular,
the system can easily be adapted to any other "items" such as samples, spare parts, tools and other inventory.
The application was developed based on The Analyses
Database and implemented at remarkably low cost (e.g. no license fees
at all) in short time, using the Linux operating system and standard off-the-shelf
computer equipment. The system went from test phase to production in less than
one week. In my (former) laboratory it helped us to improve efficiency and to save cost,
e.g. by avoiding multiple orders of identical products.

The project has its own homepage at http://chemicaldb.sourceforge.net/.
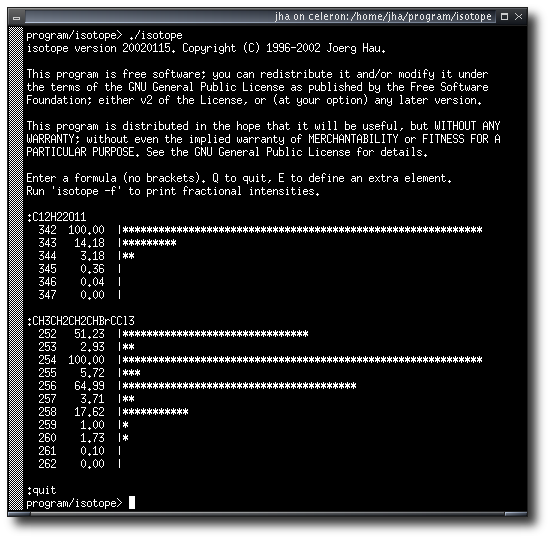
isotope is a command-line utility to calculate the isotope pattern for a
given chemical formula. It allows to run calculations interactively, in batch mode,
via the command line, or (using a webserver) via a web interface. You can easily
integrate it into your laboratory workflow, even using fully automated data processing.
Isotope has its own homepage at
http://isopat.sourceforge.net/.
hr (or HiRes, for "High Resolution") is a simple program to perform a common task in
mass spectrometry: calculate the possible elemental compositions that fit a given mass.
It allows to run calculations in batch mode, via the command line, or (using a webserver)
via a web interface. You can easily integrate it into your laboratory workflow,
even using fully automated data processing.
 .
.
Isotope has its own homepage at
http://hires.sourceforge.net/.
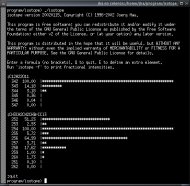
match is a program to perform the calculations required during manual
peak matching on a sector field mass spectrometer.
Although this task is performed automatically on modern instruments, there are still
some colleagues out there that [have to] do peak matching manually.
The original program was written sitting at the console of a VG7070
back in 1994, but of course it is applicable to any sector field MS
that is equipped with a unit for manual peak matching.
The program runs under MS-DOS, or in a "DOS window" under various
flavours of MS-Windows. It is copyrighted by me, but use is free - see the
file README.TXT included in the archive.
 .
.
Click here to download the program.
This includes a few reference data files. The latest version is 1.2.
Do you run one or more machines under Unix or VMS and do you wish
you had a cheap second (or third or fourth ...) access to it, with full graphical
capabilities? Well, this little article is for you.
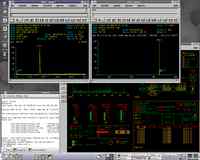
How to use Linux to share your High-end Workstation.
This has nothing to do with mass spectrometry, but anyway ;-)
bruread-nmr is a simple a program to access and display NMR data
in the Bruker XWIN-NMR format. You can display either the real or the
imaginary part of the spectrum, or the FID. -
The program has a command-line interface and a graphic display based on gnuplot.
It supports mouse zoom and manual peak annotation.
However, please note that this is merely an NMR spectrum viewer - it is
not a data evaluation suite.
The project has its own homepage at http://bruread.sourceforge.net/.
These are miscellaneous pieces of code that I have collected over the years.
Gnuplot
Map view in gnuplot
set pm3d map
set yrange [*:*] reverse
splot 'sample.dat' matrix
A nice 2D-Plot color palette is: black - brown - dark red - red ... white on "sky-blue" background (seen on SGMS 2003).
Plotting mass spectra in gnuplot
set xlabel "m/z"
set ylabel "Abundance"
set tics out
set xtics nomirror
set border 31
set nokey
Plotting UV spectra in gnuplot
set nogrid
set nokey
set nolabel
set size ratio 1 1,1
set tics in
set xlabel "nm"
set ylabel "mAU"
set xrange [180:400]
set data style lines
#set term postscript eps solid "Times-Roman"
set term aifm
set title "Name of this compound"
set outp "data.ai"
plot "data.dat"
Re-scaling gnuplot eps files to print in full-size A4
sed '/%%EndComments/ a\
90 rotate\
-60 -670 translate\
2.1 2.1 scale' file.eps | lpr -P NameOfPrinterQueue
We can use filledcurve to print chromatograms
plot sin(x) with filledcurve y1=-0.5
plot sin(x) with filledcurve x1
Plotting of multiple data files by wildcard
list = system('ls *red[0-9].dat *green*dat | sort -t. -k2')  # get a sorted list via system call
t(s) = (s2 = s[15:*], s2[0:strlen(s2)-4])                    # remove first 15 and last 4 chars from filenames
set ylabel "Volt"
set xlabel "hours"
plot for [file in list] file using ($1/3600):2 w lin title t(file)
Data processing
Derivative with awk:
#! /usr/bin/awk -f
BEGIN { firstline = 1 }

#$0 !~ ^# { if (firstline == 1) {
{ if (firstline == 1) {
    old_x = 1
    old_y = 1
    firstline = 0
  } else {
    print (old_x + $2)/2.0, "\t", (old_y - $3)/(old_x - $2), "\t"
    old_x = $2
    old_y = $3
  }
}
Numerical differentiation with octave:
load 'data.dat'
x=data(:,1);
y=data(:,2);
dx=diff(x);
dy=diff(y);
# now we need to get them to same array length. interpolate:
points = [x(1:numel(x)-1)+dx(1)/2, diff(data(:,2))./dx];
fd=fopen("outfile","wt")
fprintf(fd, "%14.6f %14.6f\n", reshape(points', 1, numel(points)));
fclose(fd);
disp("Done!");
Low-pass filter 1st order with gnuplot and awk. d is the damping:
gnuplot> plot "< awk 'print $2" < file.dat" using 1 with lp
gnuplot> plot "< awk -v d=2 'i=(d*i+$2)/1+d); print i' < file.dat" using 1 with lp
Things that others wrote
- Gnuplot, a powerful command-line plotting
utility. Available for many platforms, including Linux, DOS and Windows. A quick but thorough tutorial
is at HP Gavin's page.
More information is available in the FAQ.
- Ethan Merritt is an active gnuplot developer and has a
page with
actual patches and on-going work and N. Devillard has written a number of
gnuplot interfaces in ANSI C and the
blog of Gnuplotter provides lots of tricks and nice visual stuff.
- Gri is "an extensible plotting
language for producing scientific graphs, such as x-y plots, contour plots and image
plots". There is (imho ;-) some similarity to gnuplot.
- If the capabilities of gnuplot are not enough for you, try
Grace.
In the frame of a few projects have been working on neurosignal data processing. Here are some links that I found useful:
- BioSig, an open source software library for biomedical signal processing, including EEG, ECoG, ECG, EOG, EMG, etc.
- EEGLAB, "an interactive Matlab toolbox for processing continuous and event-related EEG, MEG and other electrophysiological data".
- A description of the BioSemi file format.
- The European Data Format (EDF), a file format for exchange and storage of multichannel biological and physical signals.